57.
The answer is: A
Explanation
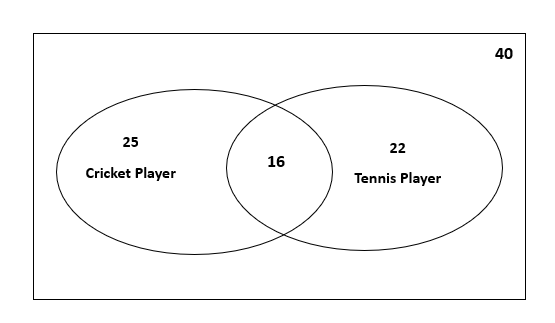
Based on the Venn diagram provided, here is the breakdown of the information:
Key Data Points
- Total People surveyed : 40
- Cricket Players : 25
- Tennis Players : 22
- Both Cricket and Tennis : 16
Detailed Analysis
- Only Cricket Players: $25 - 16 = \mathbf{9}$
- Only Tennis Players: $22 - 16 = \mathbf{6}$
- Total People who play at least one sport: $9 + 16 + 6 = \mathbf{31}$
- People who play neither sport: $40 - 31 = \mathbf{9}$